
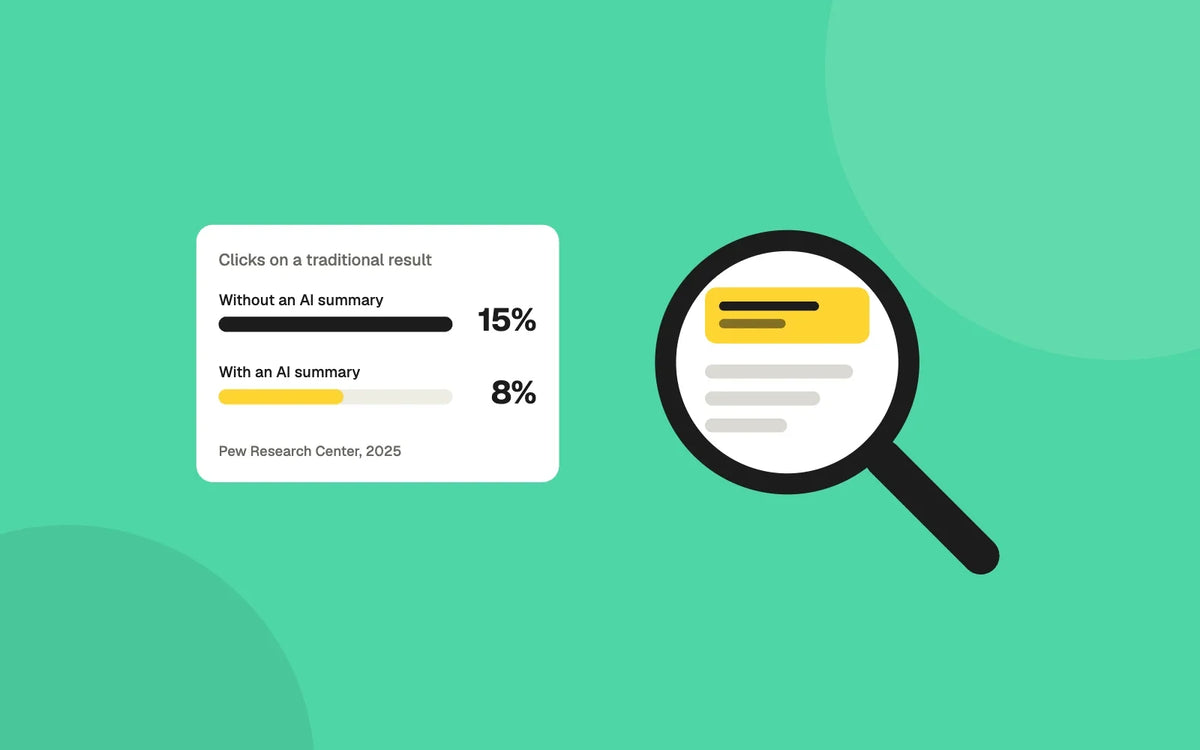
Key number: 8% vs 15%. Share of Google visits with a click on a traditional result, with and without an AI summary, in a Pew Research Center study of March 2025 browsing.
Search engine optimization has always been a mix of things you control and things you do not. In 2026 the second group got larger. Google now shows AI-written summaries above the results for a share of queries, and several studies say people click less when one appears. Other studies find a smaller effect, and Google says the total volume of clicks to websites has been relatively stable.
This article sets out what the published data shows, where the studies disagree and why, and which parts of SEO remain practical work for a business that sells online. It does not promise rankings, because no one outside Google can.
How much traffic organic search brings depends on who measured it
Business owners often ask what share of their traffic should come from organic search. Published answers range from about one sixth to more than half, and the spread is mostly a matter of method.
| Study | Organic share of traffic | Sample and period |
|---|---|---|
| Semrush traffic channel mix study (a software vendor) | 16.04% (median) | More than 50,000 sites in 17 industries, worldwide, January to December 2025. Direct traffic was 64.69%. |
| Conductor organic benchmarks (a software vendor) | 33% (average of seven industries) | More than 800 enterprise domains, desktop, global, June 2023 to May 2024 |
| BrightEdge (a software vendor) | 53% of trackable traffic | 2019 data. Direct traffic is not counted as trackable. |
A median across many small sites, an average across large enterprise domains and a share of only the traffic that can be attributed will not agree. The practical reading is that the share varies widely by business, and the only figure that matters for your store is your own. Search Console and your analytics show it.
What happens to clicks when Google shows an AI summary
The most carefully described study comes from Pew Research Center, which is not a seller of SEO tools. It tracked the browsing of 900 US adults in March 2025 and looked at 68,879 Google searches. Google showed an AI summary on 18% of those searches. When it did, people clicked a traditional result link in 8% of visits. When it did not, they clicked in 15% of visits. People clicked a link inside the AI summary itself in 1% of visits, and they ended their browsing session on the results page more often with a summary (26%) than without one (16%).

| Behavior | Share of visits |
|---|---|
| Clicked a traditional result, no AI summary | 15% |
| Clicked a traditional result, AI summary shown | 8% |
| Ended the session on the results page, no AI summary | 16% |
| Ended the session on the results page, AI summary shown | 26% |
Software vendors that watch search data report effects of different sizes, each with its own sample:
- Ahrefs compared 300,000 keywords, half with an AI Overview and half without, using Search Console data. It found that the position 1 click-through rate was 58% lower where an AI Overview showed. Ahrefs describes this as a correlation, not proof of cause.
- Seer Interactive studied 3,119 informational queries across 42 client accounts and 25.1 million organic impressions. Click-through rate on queries with an AI Overview fell from 1.76% in June 2024 to 0.61% in September 2025, while queries without one measured 1.62% in September 2025.
- Semrush followed the same keywords before and after an AI Overview appeared and found a small change in the other direction: the zero-click share went from 33.75% to 31.53%. It also found that AI Overviews appeared for 6.49% of queries in January 2025, 24.61% in July 2025 and 15.69% in November 2025, across more than 10 million keywords. The rate moves a lot.
- Google says, in a post from August 2025, that total organic click volume from Search to websites has been relatively stable year over year. The post gives no figures or sample.
These findings can all be true at once. The studies count different things (visits, searches or queries), use different panels and devices, and cover different periods. Queries that trigger AI summaries also lean toward informational questions, which have always produced fewer clicks than purchase searches. Measuring the same keywords before and after is a fairer test than comparing two groups of keywords, which is why the Semrush result and the Ahrefs result do not contradict each other as sharply as they first look.
Zero-click figures need the same care. SparkToro, working with Datos data, reported that 58.5% of US Google searches ended with no click to any site in 2024 and, in a 2026 update using a different panel, 68.01%. SparkToro itself notes that the panels differ, so the two numbers are not a trend line.
Click-through rate by position, and what the AI Overview changes
Position still matters a great deal, with most clicks going to the first three results. Advanced Web Ranking estimates click-through rates from about 1.75 million US search result pages a month. For July 2026 on desktop in the United States, it puts position 1 at 20.02% across all result pages and 9.69% on pages that include an AI Overview.

| Position | All result pages | Pages with an AI Overview |
|---|---|---|
| 1 | 20.02% | 9.69% |
| 2 | 10.36% | 3.69% |
| 3 | 3.89% | 1.70% |
| 4 | 1.71% | 1.27% |
| 5 | 1.08% | 1.02% |
| 6 | 0.73% | 0.55% |
| 7 | 0.46% | 0.35% |
| 8 | 0.47% | 0.34% |
| 9 | 0.54% | 0.47% |
| 10 | 0.58% | 0.43% |
Older studies give higher figures for position 1. Backlinko, with Semrush, reported an average of 27.6% across about 4 million results, and the top three positions took 54.4% of clicks. Click-through studies differ in year, device, query mix and method, so use them to see the shape of the curve and not as a forecast for your pages.
What Google says you need for AI features
Google's documentation on AI features in Search says there are no additional requirements to appear in AI Overviews or AI Mode, and that the foundational SEO best practices still apply. Its guidance on generative AI search says structured data is not required for it. In other words, the company states that there is no separate technical checklist for AI answers. These are Google's statements about its own product, and they are worth reading as such.
The technical basics, with the actual thresholds
Core Web Vitals are three measurements of how a page loads and responds, assessed at the 75th percentile of page loads on mobile and desktop. Google's web.dev documentation gives the thresholds.
| Metric | What it measures | Good | Poor |
|---|---|---|---|
| Largest Contentful Paint (LCP) | Time until the main content is visible | 2.5 seconds or less | More than 4.0 seconds |
| Interaction to Next Paint (INP) | How quickly the page responds to input | 200 milliseconds or less | More than 500 milliseconds |
| Cumulative Layout Shift (CLS) | How much the layout moves while loading | 0.1 or less | More than 0.25 |
Google's page experience documentation is careful about what this means. It says there is no single page experience signal, and that good scores do not guarantee a top ranking. The case for speed is also a business case. Vodafone Italy reported that improving Largest Contentful Paint by 31% came with 8% more sales in an A/B test. That result is company-reported, and the case study does not give the test length or sample size, so treat it as an example and not a benchmark.
Two more basics are documented by Google. It uses the mobile version of a site's content for indexing and ranking, so the phone version of every page needs the full content, not a reduced one. And its guidance on content asks for people-first material: content created primarily to help people, and not to attract search traffic.
Ecommerce details that are well documented
- Product structured data. Google distinguishes product snippets, for pages that describe a product but cannot sell it, from merchant listings, for pages where a shopper can buy. Merchant listings require name, image and offers, and only pages where a product can be purchased are eligible. Markup has to match what visitors see on the page, and Google recommends JSON-LD. Appearance in rich results is never guaranteed.
- Free listings in Google Merchant Center. Products can appear in Google surfaces at no cost, provided the shipping and return policy settings and required product attributes are in place. Display is not guaranteed.
- Faceted navigation. Filters can create a very large number of URLs that add little for search. Google's guidance lists ways to limit crawling of them, such as robots.txt rules, and warns that some options, such as canonical tags and nofollow, are weaker signals over time.
- Duplicate content. Google decides which pages it treats as duplicates, based on how similar the content is. Redirects and rel=canonical are strong signals for choosing the preferred URL. A sitemap is a weak one.
What it means for your store
The data does not say that SEO stopped working. It says the path from a search to a click is less predictable than it was, and that some of the risk sits in informational queries that were always the least likely to turn into sales. A practical plan keeps the effort on what you can measure and change.
- Measure your own numbers first. In Search Console, track impressions and clicks separately, and compare page groups. Falling clicks with steady impressions point to a change in the results page, not a loss of visibility.
- Separate query types. Look at informational queries and purchase-intent queries on their own. The studies suggest the effect is larger on the first group.
- Pass Core Web Vitals on mobile. Use the published thresholds and fix the slowest templates first: product, collection and home pages.
- Make every product page complete. Name, image, price, availability and a clear policy, with structured data that matches the visible page.
- Control duplicate and filter URLs. Choose one preferred URL for each product, and limit crawling of filter combinations that add no value.
- Write for people. Product guides, comparisons and answers that draw on your own data and experience are harder to replace with a summary than generic descriptions are.
About these numbers
Most of the click studies come from companies that sell SEO or analytics tools. Pew Research Center is the exception, and its sample is US adults in one month. Google's statements are about its own product and come without data.
The Ahrefs finding is a correlation. The Advanced Web Ranking figures are estimates from its own tracking, and the click-through table is for desktop in the United States. The two SparkToro zero-click figures come from different panels.
Nothing here is a promise about where a page will rank. Use the figures as context for your own Search Console data.
Sources
- Pew Research Center, Google users are less likely to click on links when an AI summary appears in the results. July 22, 2025. 900 US adults, 68,879 Google searches, March 2025.
- Semrush, traffic channel mix study. April 27, 2026. January to December 2025 data.
- Conductor, organic website traffic industry benchmarks. Updated July 16, 2024.
- BrightEdge, organic share of traffic increases to 53%. 2019 data. Sample described by Search Engine Land as thousands of domains and tens of billions of sessions.
- Ahrefs, AI Overviews reduce clicks. February 4, 2026, modified October 15, 2026.
- Seer Interactive, AIO impact on Google CTR, September 2025 update. November 4, 2025.
- Semrush, AI Overviews study. December 15, 2025.
- SparkToro, 2024 zero-click search study. July 1, 2024.
- SparkToro, in 2026 less than one third of Google searches still send a click. June 8, 2026.
- Google Search Central, AI features and your website. December 10, 2025.
- Google Search Central, generative AI optimization guide. July 10, 2026.
- Google, AI in Search is driving more queries and higher quality clicks. August 6, 2025.
- Advanced Web Ranking, organic click-through rates. Page dated September 14, 2026. July 2026 data, US desktop.
- Backlinko and Semrush, Google CTR stats. Updated April 16, 2025.
- web.dev, Largest Contentful Paint. September 4, 2025.
- web.dev, Interaction to Next Paint. September 2, 2025.
- web.dev, Cumulative Layout Shift. April 12, 2023.
- Google Search Central, page experience. September 22, 2026.
- Google Search Central, creating helpful, reliable, people-first content. October 5, 2026.
- Google Search Central, mobile-first indexing best practices. December 10, 2025.
- Google Search Central, product structured data. December 10, 2025.
- Google Search Central, merchant listing structured data.
- Google Merchant Center Help, free product listings.
- Google, managing faceted navigation URLs. December 18, 2025.
- Google Search Central, consolidate duplicate URLs. July 10, 2026.
- web.dev, the business impact of Core Web Vitals (Vodafone Italy). September 1, 2021.