
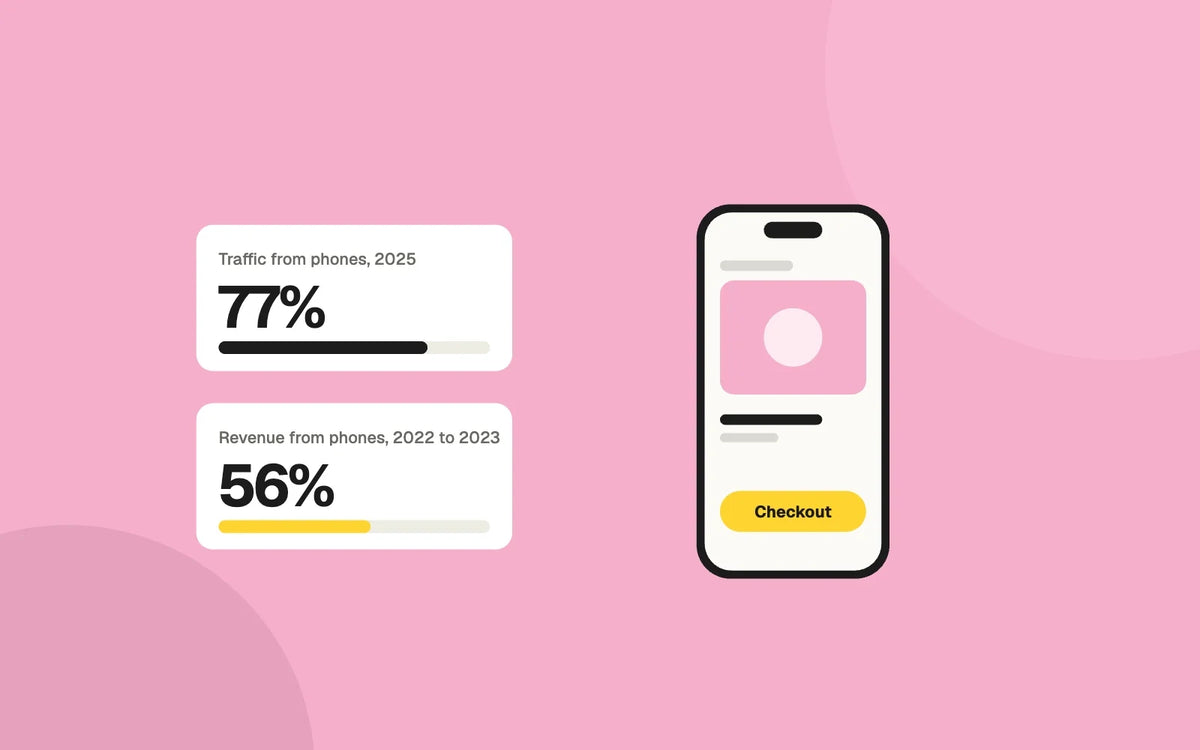
Key number: 77%. Share of retail site traffic that came from mobile devices in 2025.
The data

- In 2025, desktop converted roughly 40% to 70% better than mobile in every retail sub-industry.
- In luxury, conversion was 1.4% on desktop and 0.9% on mobile.
The numbers in a table
| Item | Percent | Notes |
|---|---|---|
| Traffic, October 2022 to December 2023 | 77% | 1,673 websites |
| Revenue, October 2022 to December 2023 | 56% | 1,673 websites |
| Traffic, 2025 | 77% | More than 2,200 websites |
What it means for your store
Most visits start on a phone, yet phones earn a smaller share of revenue than of traffic. Review the phone path first: product page, cart and checkout. Check page speed, tap targets and how much a shopper has to type.
About these numbers
The two reports cover different periods and samples. The revenue share comes from the earlier report only.
Sources
- Contentsquare, 2024 Retail Digital Experience Benchmark Report. October 2022 to December 2023, more than 25 billion sessions across 1,673 websites.
- Contentsquare, 2026 Digital Experience Benchmarks. 2025 data, more than 26 billion sessions across more than 2,200 websites.